
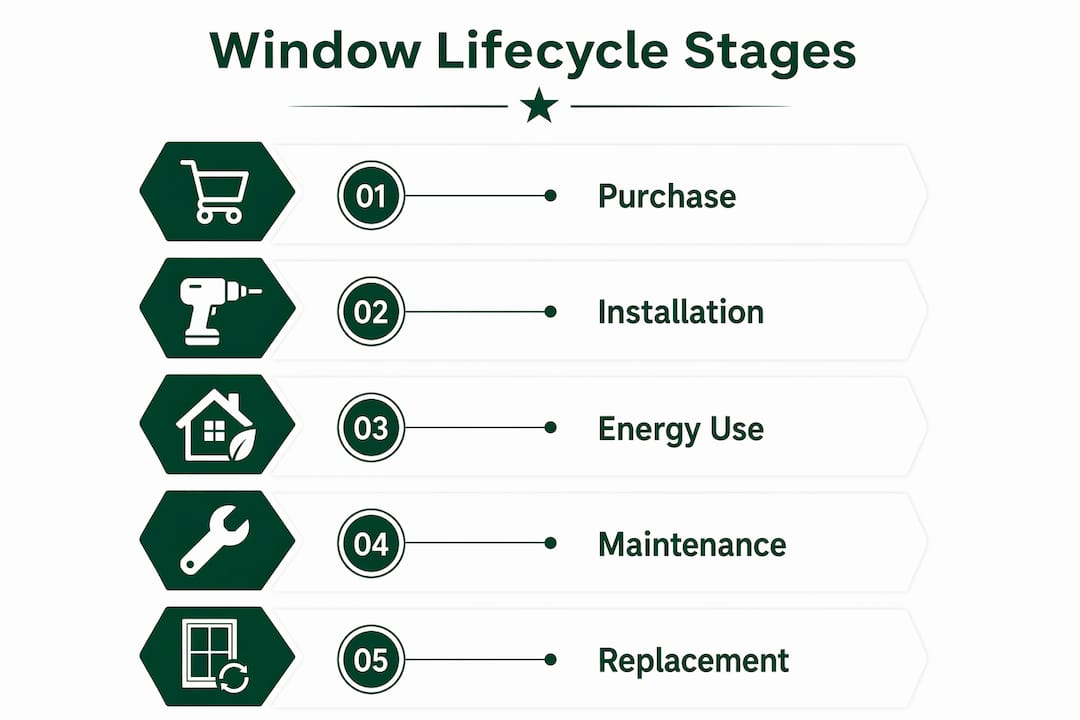
Window lifecycle cost is the complete financial total of owning, operating, maintaining, and disposing of a window system across its full expected lifespan. Under Section 707 of Executive Order 13123, the U.S. Department of Energy defines life-cycle costs as the sum of present values covering investment, installation, energy, operating, maintenance, and disposal costs over a project’s lifetime. That definition matters because the purchase price is only the visible tip of a much larger iceberg.
The core components of window lifecycle cost include:
- Acquisition costs: purchase price, freight, and installation labor
- Operating costs: modeled energy consumption over the window’s lifespan
- Maintenance and repairs: seal-failure reserves, caulking, hardware, and periodic fixes
- Tenant disruption: lost productivity and temporary relocation during installation or major repairs
- Replacement timing: scheduled or emergency glass unit swaps mid-lifecycle
- Disposal costs: removal and recycling or landfill fees at end of life
- Residual value: any salvage credit that offsets total cost
AACE International’s recommended practice 138R-25 frames this as total cost of ownership across the full asset life, not just the acquisition phase. Windows generally serve for multiple decades, so the operating and sustaining costs that accumulate after installation frequently exceed the original purchase price.
What drives window lifecycle cost higher than you expect?
Every cost category above carries its own variables, and several interact in ways that catch property owners off guard.
Acquisition and installation set the baseline. According to National Renewable Energy Laboratory cost modeling, window hardware costs made up roughly 55% of the total installed cost, with labor, permitting, shipping, and overhead filling the rest. That split shifts depending on whether you choose insert or full-frame replacement, and full-frame replacements typically cost more per window than insert replacements.

Energy consumption is where the long-term math gets interesting. The U.S. DOE publishes annual real energy price escalation rates by census region and fuel type, which means a window’s modeled energy cost in year one looks very different by year 20. Climate matters enormously here: a low-E triple-pane unit that pays off in Kansas City’s mixed climate may take far longer to recover its premium in a mild coastal zone.
Maintenance and seal failure are the costs most owners underestimate. Seal degradation in insulated glass units (IGUs) often begins showing up as fogging or condensation between panes after several years, and replacing individual IGUs mid-lifecycle adds unplanned expense. A realistic lifecycle model builds in a seal-failure reserve from day one.
Hidden costs that frequently go unpriced:
- Tenant disruption during installation or emergency repairs
- Disposal fees for old glass and frame materials
- Lead-paint compliance for pre-1978 buildings ($200–$800 per project for certified handling)
- Interior trim repair and paint touch-up after full-frame removal
Window material shapes nearly every cost category. Vinyl frames carry lower upfront cost and minimal maintenance, while wood frames demand periodic painting and sealing but can last longer when properly maintained. Aluminum performs well in severe weather exposure but conducts heat, raising energy costs in extreme climates. The optimal material choice depends on climate exposure, building type, and how long you plan to hold the asset.
Why first cost alone leads to bad window investment decisions
Choosing windows based on the lowest purchase price is one of the most reliable ways to overpay over a 20-year hold. AACE International’s lifecycle costing guidance is direct on this: lifecycle costing shifts focus from lowest initial purchase cost to lowest total cost of ownership over the full asset life, because operating and maintenance costs often exceed the initial investment.
The Royal Institution of Chartered Surveyors (RICS) reinforces this through its life cycle costing practice information, which defines LCC as a tool for comparing alternatives that differ not just in initial cost but in subsequent operational costs. The point is to put every option on the same financial footing before committing.
Optimism bias is the specific trap to watch for. Energy savings projections borrowed from manufacturer brochures tend to assume ideal installation, no seal degradation, and stable utility rates. Real-world performance diverges from those assumptions, sometimes significantly. Treat energy model outputs as variables in a range, not guarantees.
Common pitfalls that inflate real lifecycle costs:
- Accepting vendor energy savings claims without independent modeling
- Ignoring tenant disruption costs in occupied buildings
- Failing to budget for seal-failure reserves on IGUs
- Comparing windows on first cost when hold periods differ across options
Pro Tip: Run your lifecycle analysis at three hold periods, say 15, 20, and 25 years. Short holds often make premium windows look uneconomical; longer holds frequently reverse that conclusion. The WBDG lifecycle cost guidance specifically recommends multiple scenarios because owners routinely underestimate how long they actually hold a property.
How to apply lifecycle cost analysis to window upgrade decisions
The standard lifecycle cost formula runs: purchase price + freight + installation + commissioning + modeled energy use + maintenance + seal-failure reserve + tenant disruption + replacement timing + disposal, minus residual value. All future amounts get discounted to present value so you can compare options on equal terms.
Discounting matters because a dollar spent on maintenance in year 15 is worth less than a dollar spent today. The U.S. DOE publishes real discount rates and energy price escalation factors annually, updated each April, which feed directly into a rigorous present-value calculation.
Practical steps for property owners and facility managers:
- Establish a base case (current windows, do-nothing scenario) before modeling alternatives
- Get energy modeling outputs from a qualified source, not a sales brochure
- Build a window maintenance budget that includes seal-failure reserves and hardware replacement cycles
- Coordinate replacements across a building or portfolio rather than window by window
That last point carries real financial weight. Replacing windows in bulk reduces per-unit costs by 15–25% compared to piecemeal replacements, because fixed mobilization, disposal, and overhead costs spread across more units. A 10-window project handled in one mobilization costs meaningfully less than the same 10 windows replaced one at a time over five years.
Pro Tip: When comparing window technologies, separate thermal performance from acoustic, security, and aesthetic add-ons. Pricing them as a bundle obscures where the real lifecycle value comes from and makes it harder to justify the investment to stakeholders.
Complexity in lifecycle estimation is real. A sustainability research review found that adoption of lifecycle costing remains slow partly because practitioners must tailor methods to their specific building use, climate, and financial goals. Spreadsheet tools built around the DOE’s Building Life-Cycle Cost (BLCC) program can structure the calculation, though any model is only as good as its input assumptions.
How Star-ws supports lifecycle cost-efficient window upgrades
Star-ws brings the full range of services a property owner needs to act on a lifecycle cost analysis, not just sell a window.
Key services include:
- Full window replacement (residential and commercial) with energy-efficient glazing options
- IGU and glass replacement for mid-lifecycle seal failures
- Wood rot repair to extend frame life before full replacement becomes necessary
- Smart glass installation for properties targeting advanced energy and comfort performance
- Hardware and siding restoration to address maintenance costs without full replacement
Star-ws serves the Kansas City area with free estimates and financing options, which makes it practical to model a coordinated replacement project rather than defaulting to one-window-at-a-time decisions. Coordinated projects capture the bulk discount and reduce tenant disruption in a single mobilization.

For property owners ready to move from analysis to action, Star-ws offers window and glass replacement services designed around quality, transparency, and long-term performance. Contact Star-ws for a free estimate and start with real numbers rather than brochure math.
Lifecycle cost in practice: what the numbers reveal
A lifecycle analysis on a typical commercial office building in a mixed climate illustrates how the math plays out. Replacing single-pane aluminum windows with double-pane low-E vinyl units produces measurable energy savings annually, but the full picture only emerges when maintenance, disruption, and disposal costs enter the model.
NREL’s commercial stock modeling found that a high-efficiency envelope package including window replacement produced 7.2% total site energy savings across modeled U.S. commercial buildings, with the full package averaging 10.7% where applied. Those figures represent real operating cost reductions, but they sit alongside real installation costs that need to be recovered over the hold period.
For residential properties, a preventive maintenance approach often extends window life by years, deferring replacement costs and improving the lifecycle economics of existing units. The decision between maintaining and replacing is itself a lifecycle cost question, and the answer depends on current window condition, energy performance gap, and planned hold period.
Key Takeaways
Window lifecycle cost captures every dollar a property owner spends on windows from purchase through disposal, and operating costs routinely exceed the original acquisition price over a 20–60 year lifespan.
| Point | Details |
|---|---|
| Total cost, not first cost | Lifecycle cost includes acquisition, energy, maintenance, disruption, and disposal, not just purchase price. |
| Bulk replacements save 15–25% | Coordinating window projects in one mobilization reduces per-unit costs compared to piecemeal replacements. |
| Run multiple hold-period scenarios | Analyzing 15, 20, and 25-year holds reveals the true value of premium windows that short-term models undervalue. |
| Seal-failure reserves are non-optional | IGU seal degradation typically surfaces within 10–15 years; budgeting for it from day one prevents unplanned expense. |
| Energy savings are variables, not guarantees | Treat modeled energy outputs as a range; real performance depends on installation quality and maintenance history. |